Seismograms in real-time
Real time seismograms of all Collalto Seismic Network stations as well as of the other stations managed by OGS-CRS can be displayed through the following links:
Real time seismograms of all Collalto Seismic Network stations as well as of the other stations managed by OGS-CRS can be displayed through the following links:
Continuous waveform data are freely available for all stations through the web site named "OASIS - The OGS Archive System of Instrumental Seismology".
Here are the links to go into the following OASIS pages:
Seismic events located in the period 1/1/2012-31/3/2024:
More details can be found in the scientific reports.
Previous published lists have been updated due to calibrations of location and magnitude estimation procedures for the whole available dataset.
The two graphs below represent the variations of the average flow (units in thousands of standard cubic meters per hour) and of the average pressure (units in bar) measured at the well mouth during the plant's activities, in blue and in fuchsia, respectively. Horizontal thick grey lines indicate the periods of gas extraction from or injection into the reservoir. Both graphs are updated to 30/09/2025 with the data provided by Stogit Adriatica S.p.A.
TEST PAGE
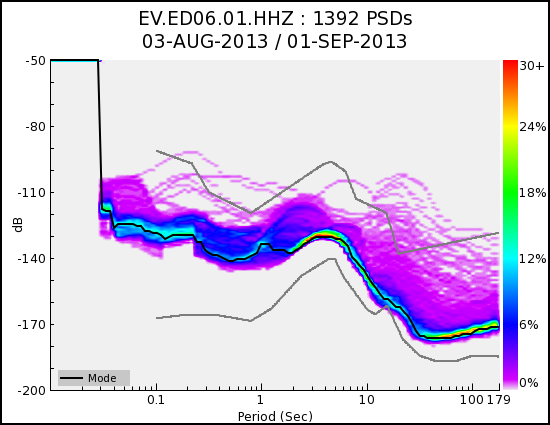
Through this pages you can view the pictures that represent the seismic noise spectra produced by PQLX software.
Figure example: station ED06, period June 2013.