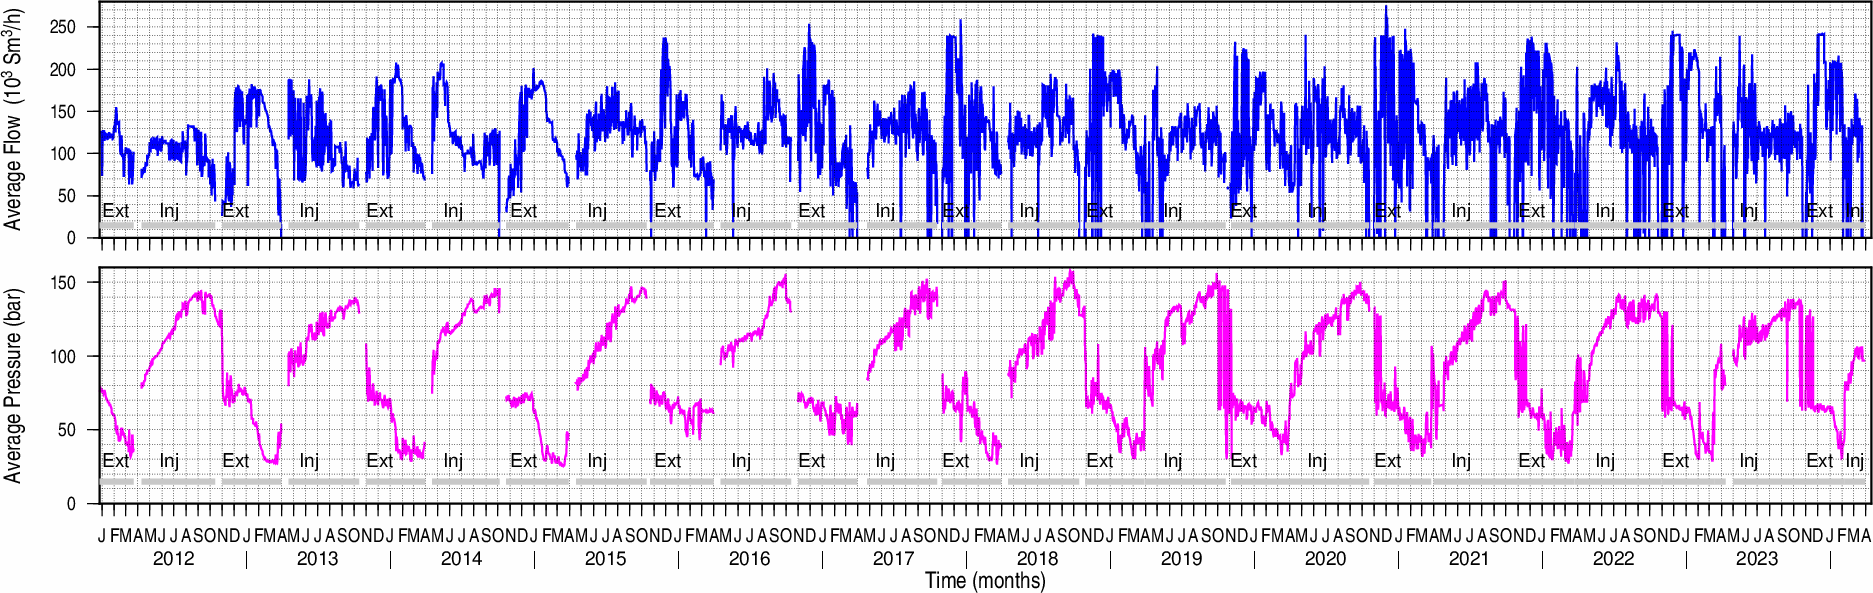
Flow and pressure data
The two graphs below represent the variations of the average flow (units in thousands of standard cubic meters per hour) and of the average pressure (units in bar) measured at the well mouth during the plant's activities, in blue and in fuchsia, respectively. Horizontal thick grey lines indicate the periods of gas extraction from or injection into the reservoir. Both graphs are updated to 31/12/2025 with the data provided by Stogit Adriatica S.p.A.